Dashboard Analytics
Contents
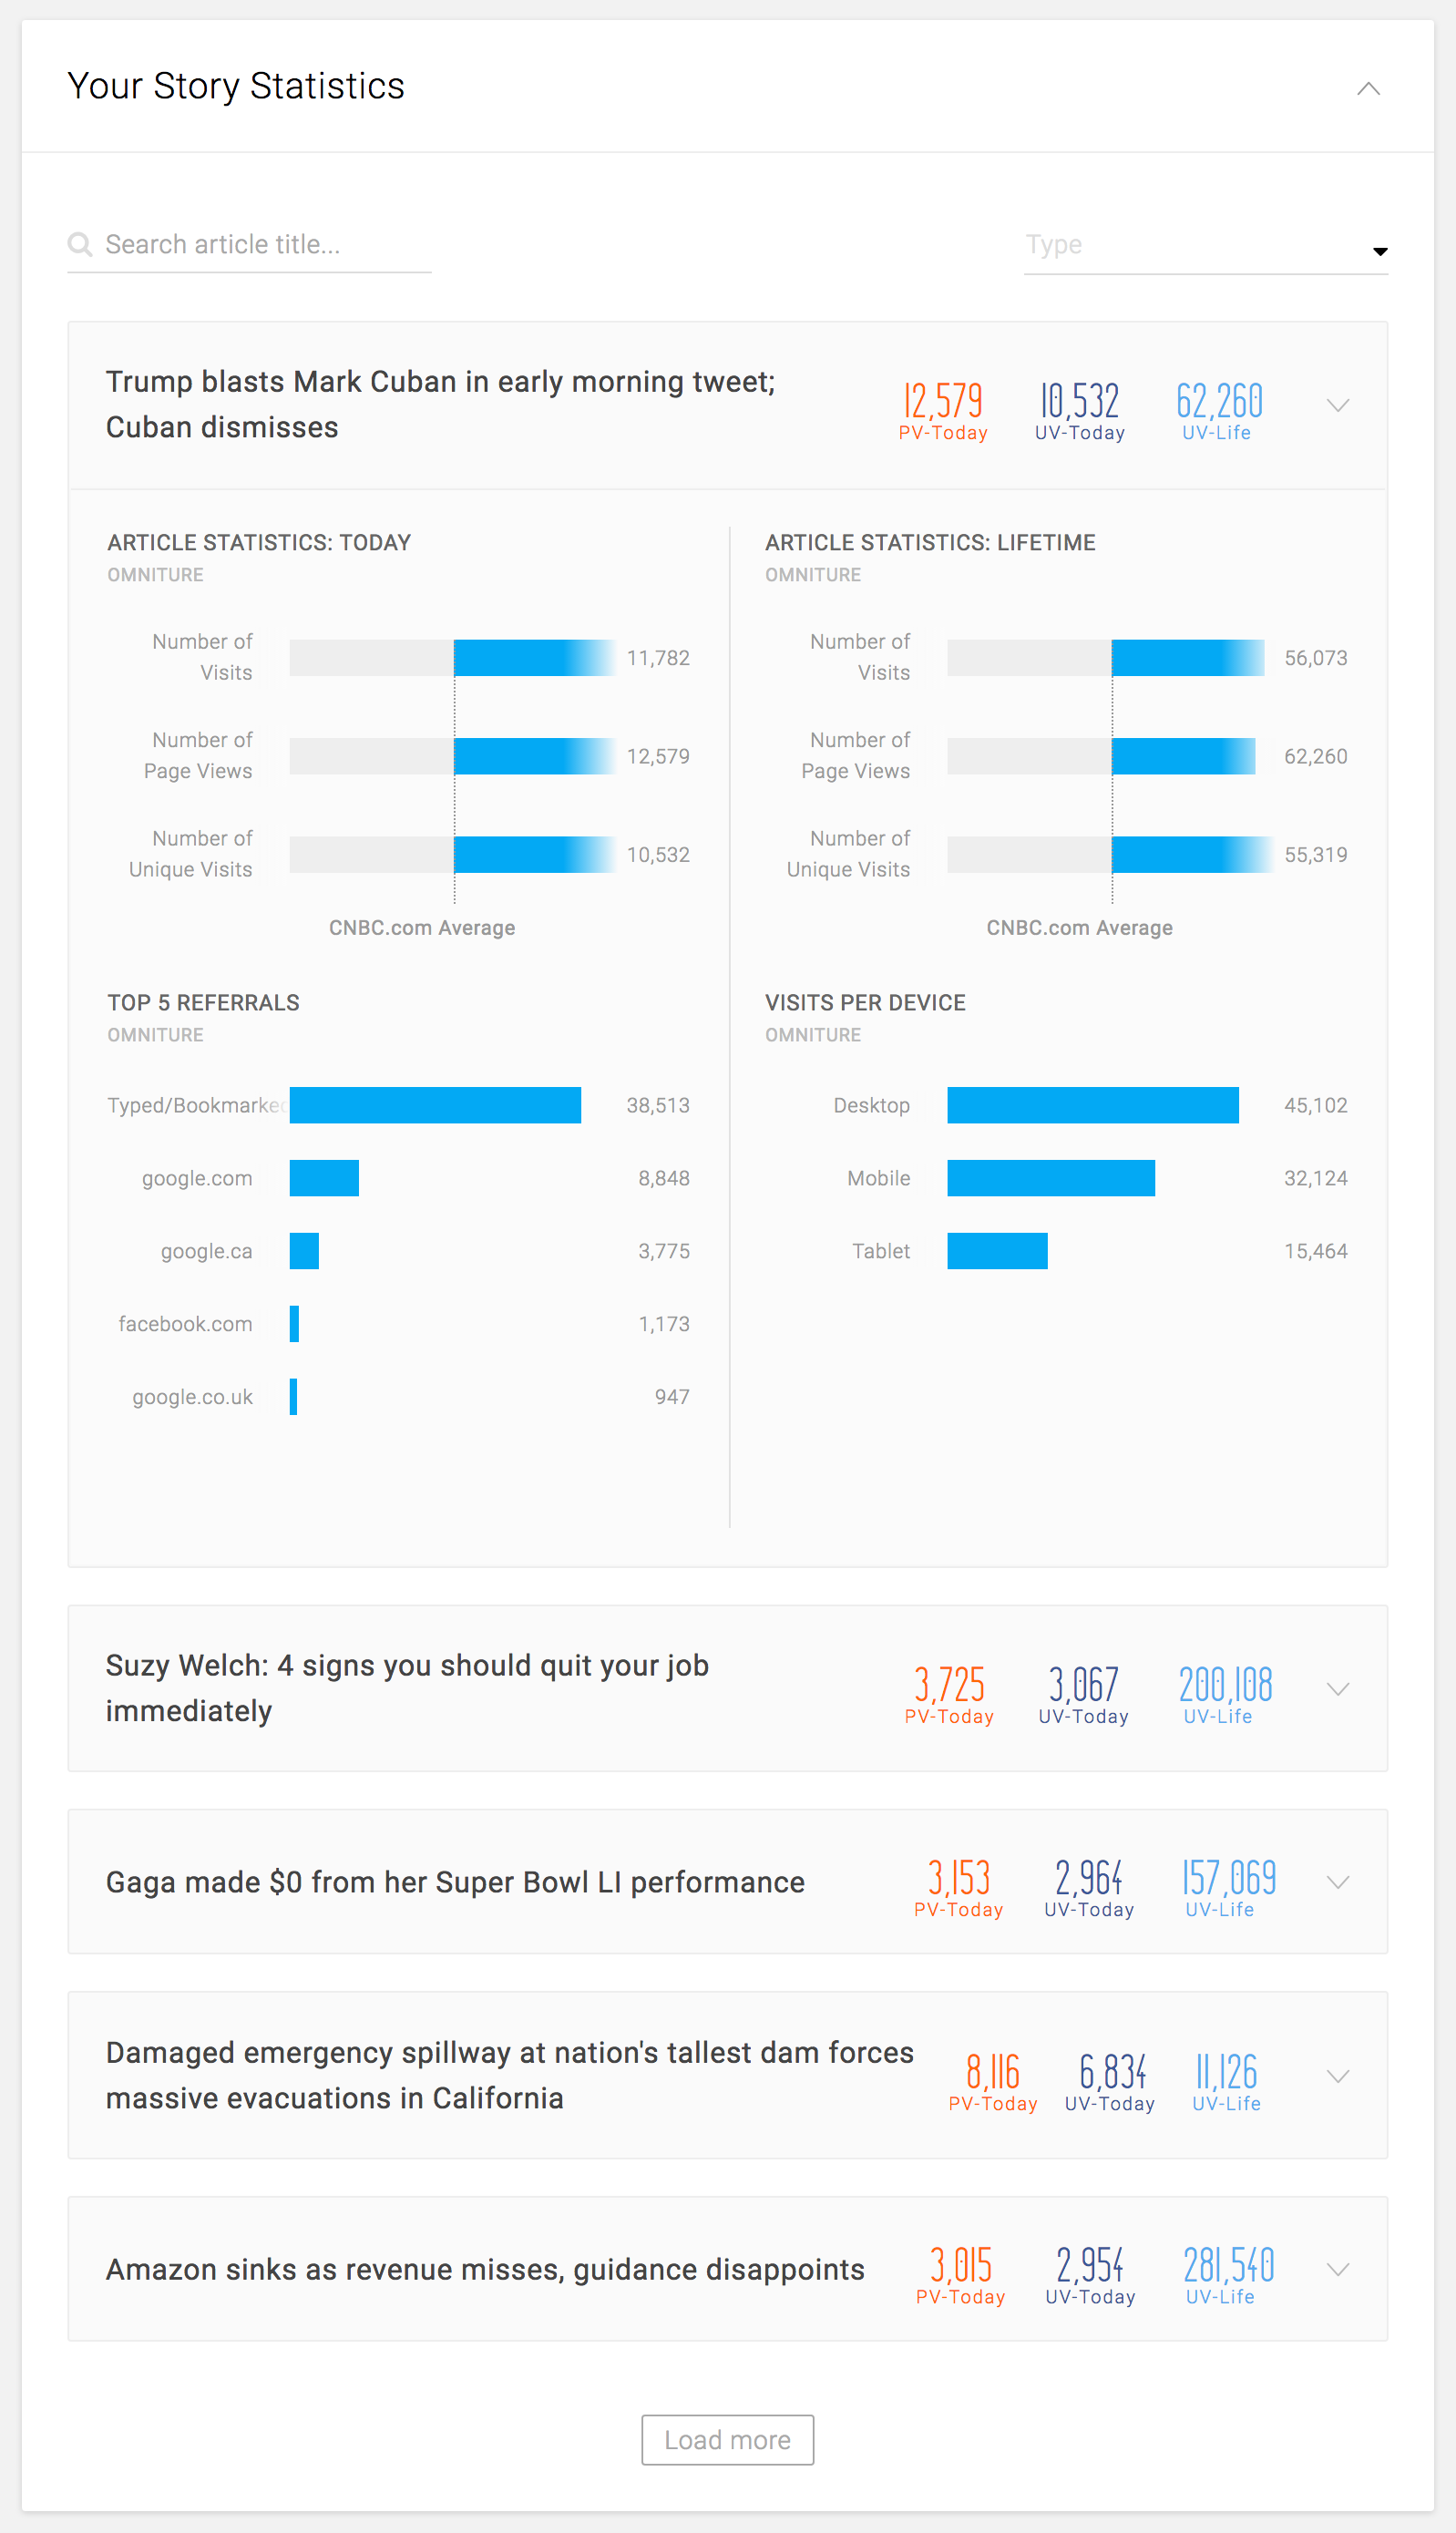
Your Story Statistics
Features
- See the statistics of the articles that the user has saved or published
- *NOTE: This would require extra build on CNBC to identify the user and match it with the revision history of the articles
- NOTE: When BEE launches, it would be on all the articles that the user has edited
- Search/filter within the card
- Search by title, slug, or ID
- Filter by content type: News Story, Partner Story, Wire Story, etc.
- *NOTE: Toolbelt would need to provide the list of IDs/articles that are inside the Breaking News Franchise in order to filter by Breaking News, as there is no separate Breaking News content type in Toolbelt
- The most recently saved or published story appears on the top, in reverse-chronological order
- Each card represents a single story
- Can be opened to reveal more detailed statistics
- 5 cards are visible in the initial view
- 5 additional cards are loaded every time the user clicks “Load More” button
Available Statistics
- On the card
- Today’s page views
- Today’s unique visitors
- Lifetimie unique visitors
- Detail
- Article statistics: Today
- Visits
- Page views
- Unique visitors
- CNBC.com average for all of the above
- Article statistics: Lifetime
- Visits
- Page views
- Unique visitors
- CNBC.com average for all of the above
- Top 5 referrals
- Name of the referrer
- Number of page views from each referrer
- Visits per device
- Desktop vs. Mobile vs. Tablet
- NOTE: Currently, mobile traffics are tracked with a separate request. CNBC is aiming to combine all platform traffic into one request.
- Desktop vs. Mobile vs. Tablet
- Article statistics: Today
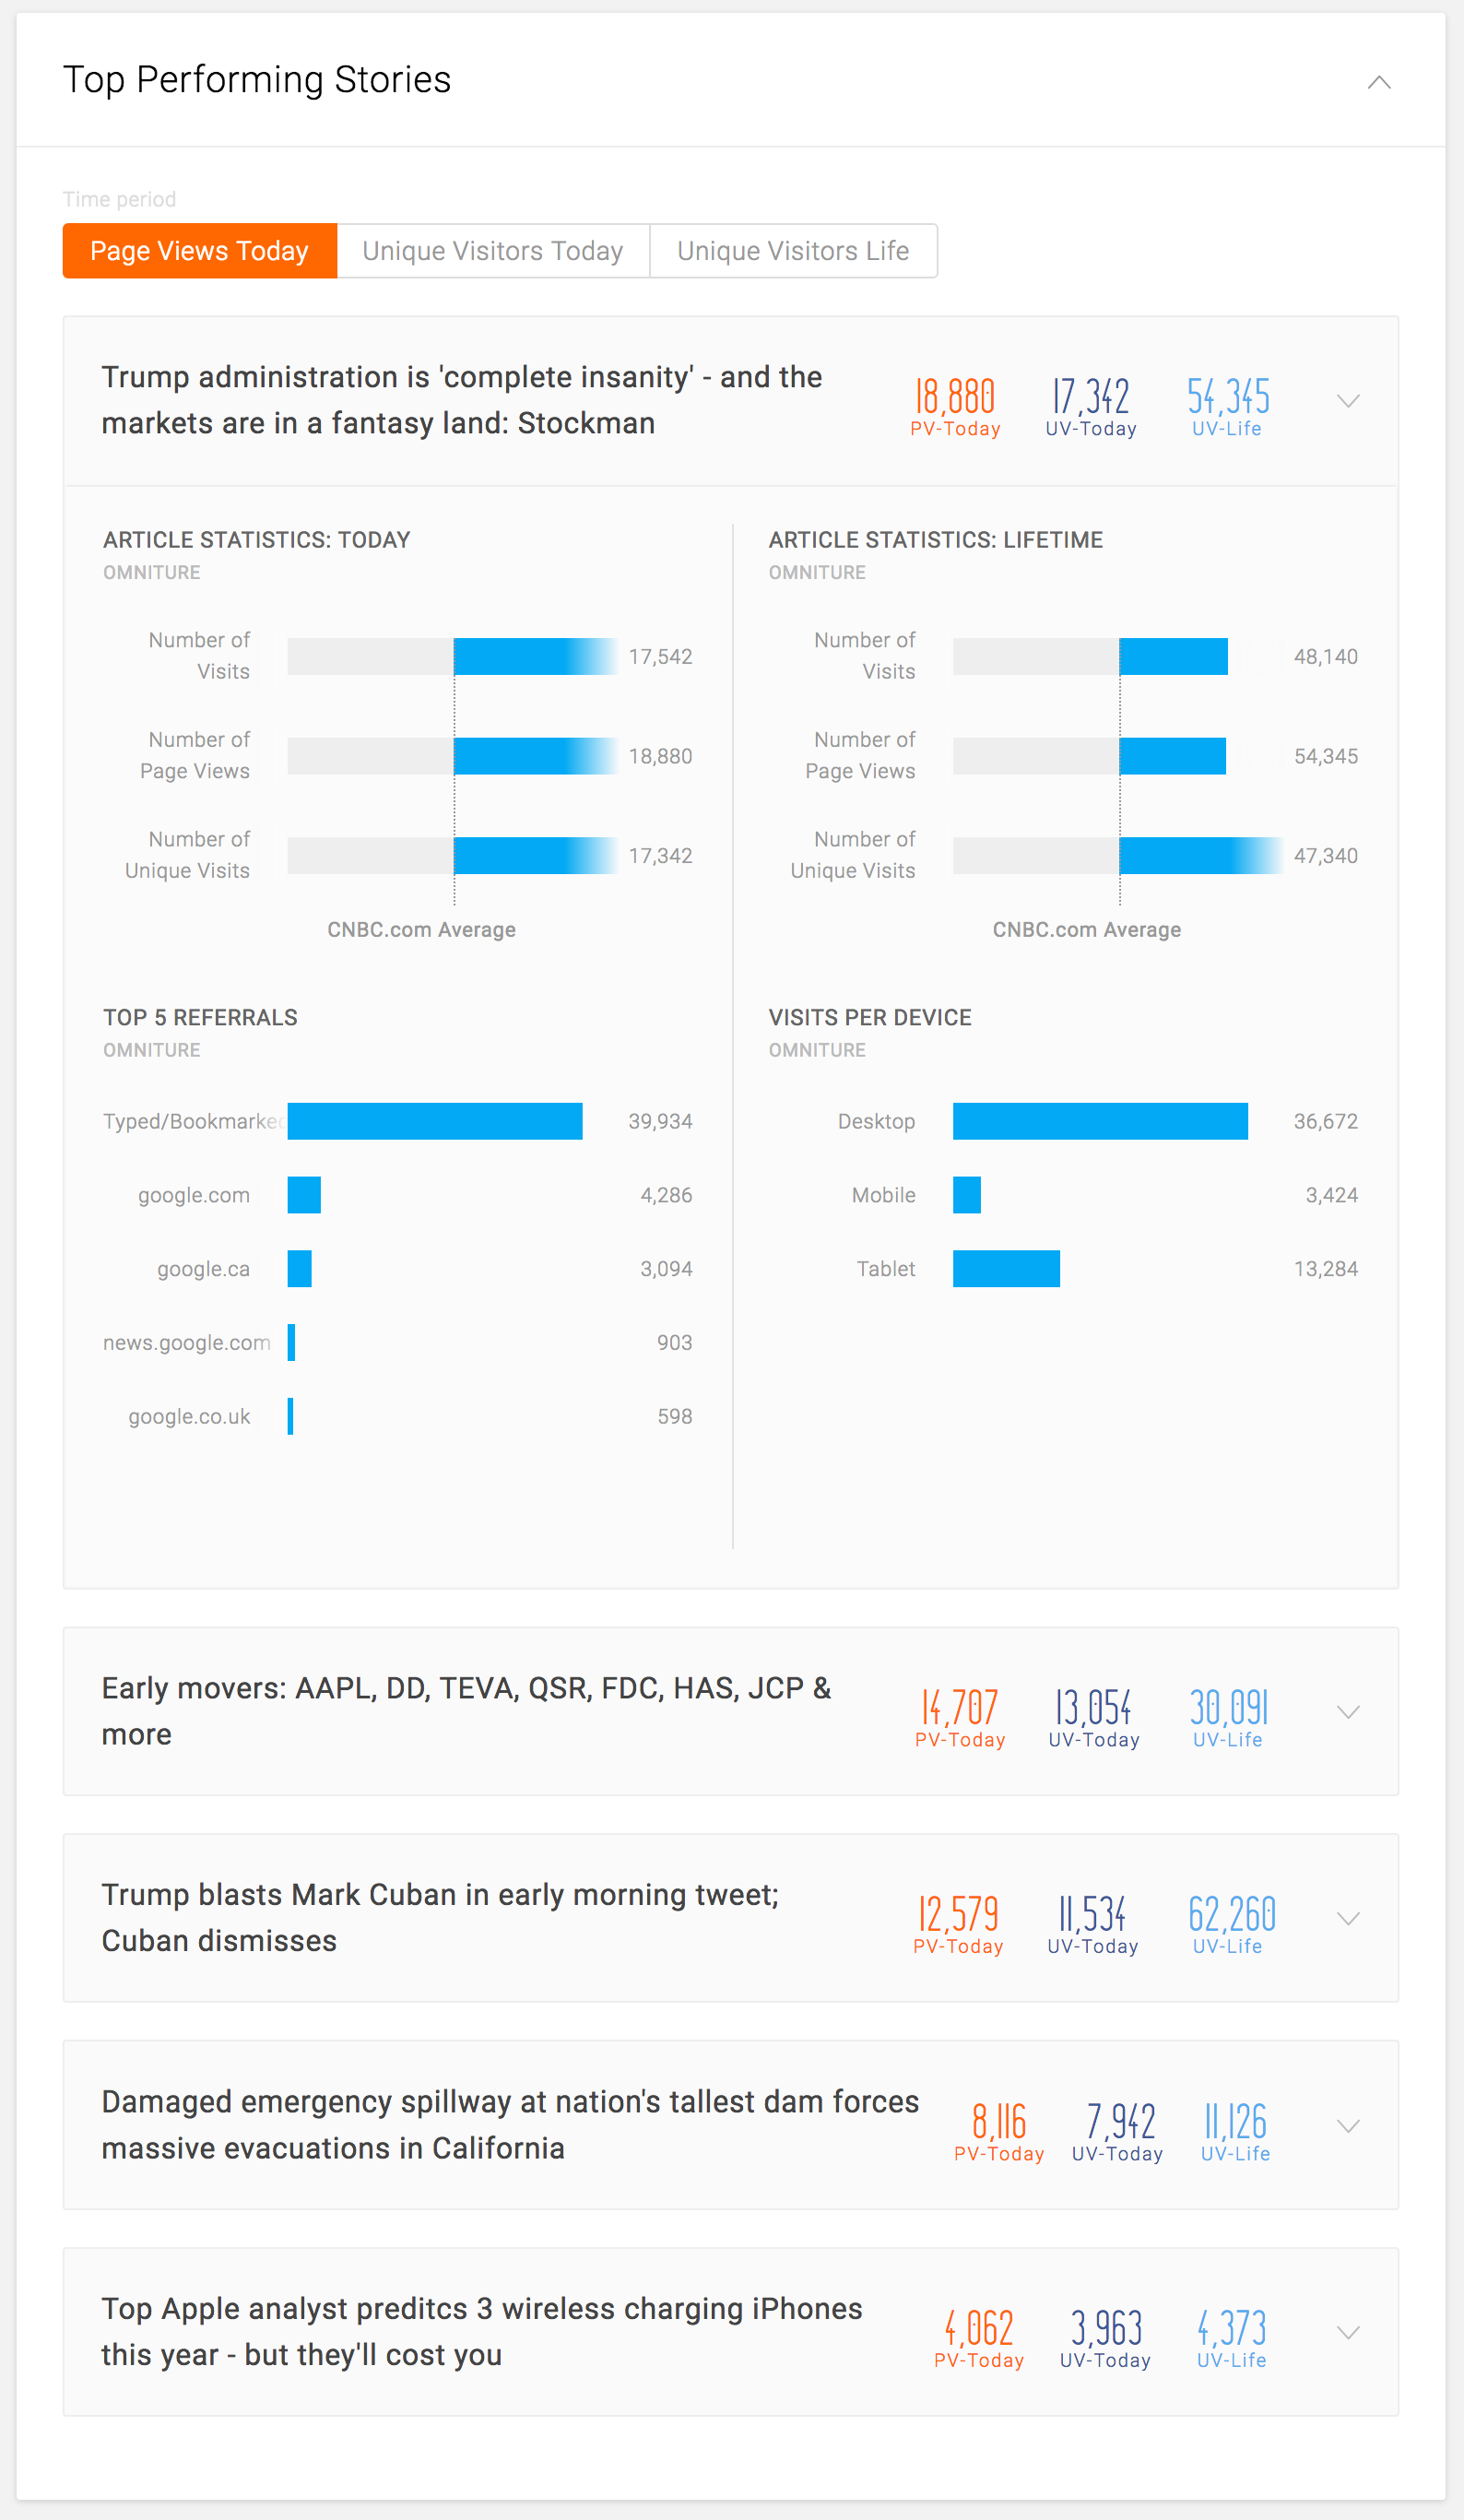
Top Performing Stories
Features
- See the statistics of the top 10 articles, in order, for the following categories:
- Page views today
- Unique visitors today
- Unique visitors lifetime
- Each card represents a single story
- Can be opened to reveal more detailed statistics
Available Statistics
- On the card
- Today’s page views
- Today’s unique visitors
- Lifetime unique visitors
- Detail
- Article statistics: Today
- Visits
- Page views
- Unique visitors
- CNBC.com average for all of the above
- Article statistics: Lifetime
- Visits
- Page views
- Unique visitors
- CNBC.com average for all of the above
- Top 5 referrals
- Name of the referrer
- Number of page views from each referrer
- Visits per device
- Desktop vs. Mobile vs. Tablet
- NOTE: Currently, mobile traffics are tracked with a separate request. CNBC is aiming to combine all platform traffic into one request.
- Desktop vs. Mobile vs. Tablet
- Article statistics: Today
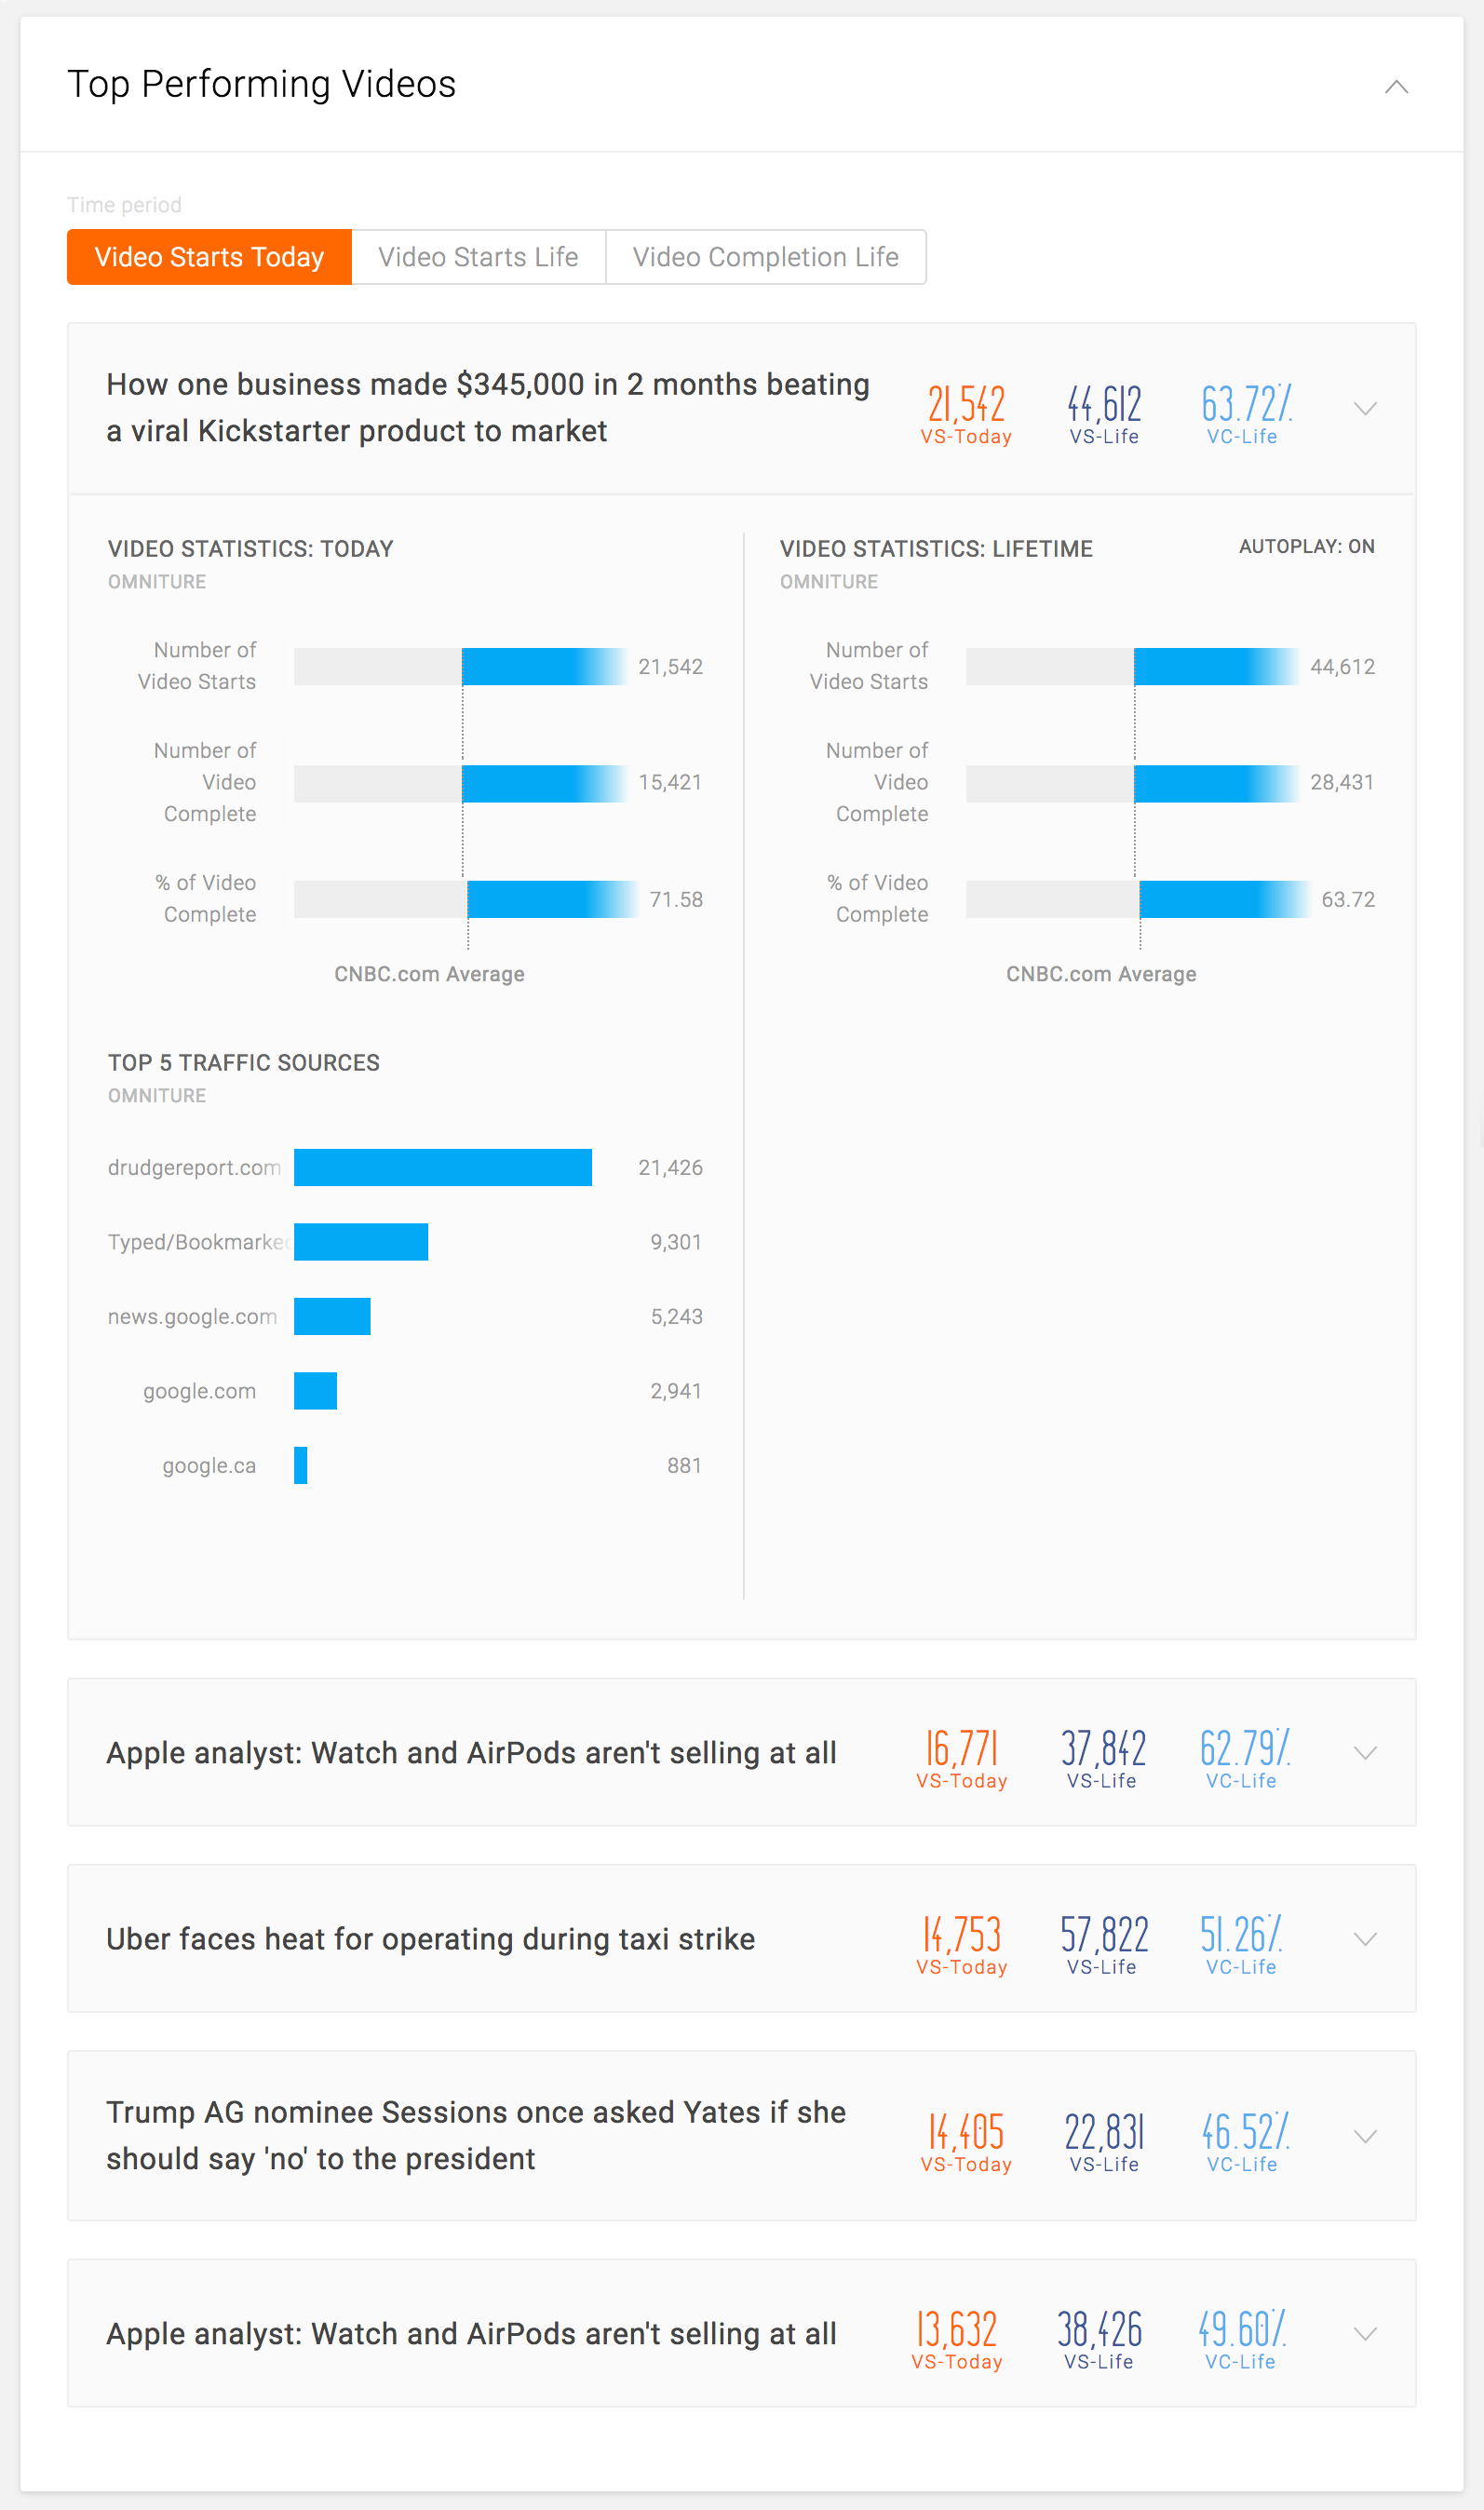
Top Performing Videos
Features
- See the statistics of the top 10 videos, in order, for the following categories:
- Video starts today
- Video starts lifetime
- Video completion rate lifetime
- Each card represents a single video
- Can be opened to reveal more detailed statistics
Available Statistics
- On the card
- Today’s video starts
- Today’s video starts
- Lifetime video completion rate
- Detail
- Video statistics: Today
- Video starts
- Video completes
- Video completion rate
- CNBC.com average for all of the above
- Video statistics: Today
- Video starts
- Video completes
- Video completion rate
- CNBC.com average for all of the above
- Top 5 traffic sources
- Name of the source
- Number of page views from each source
- Whether the video is on autoplay or not
- Video statistics: Today
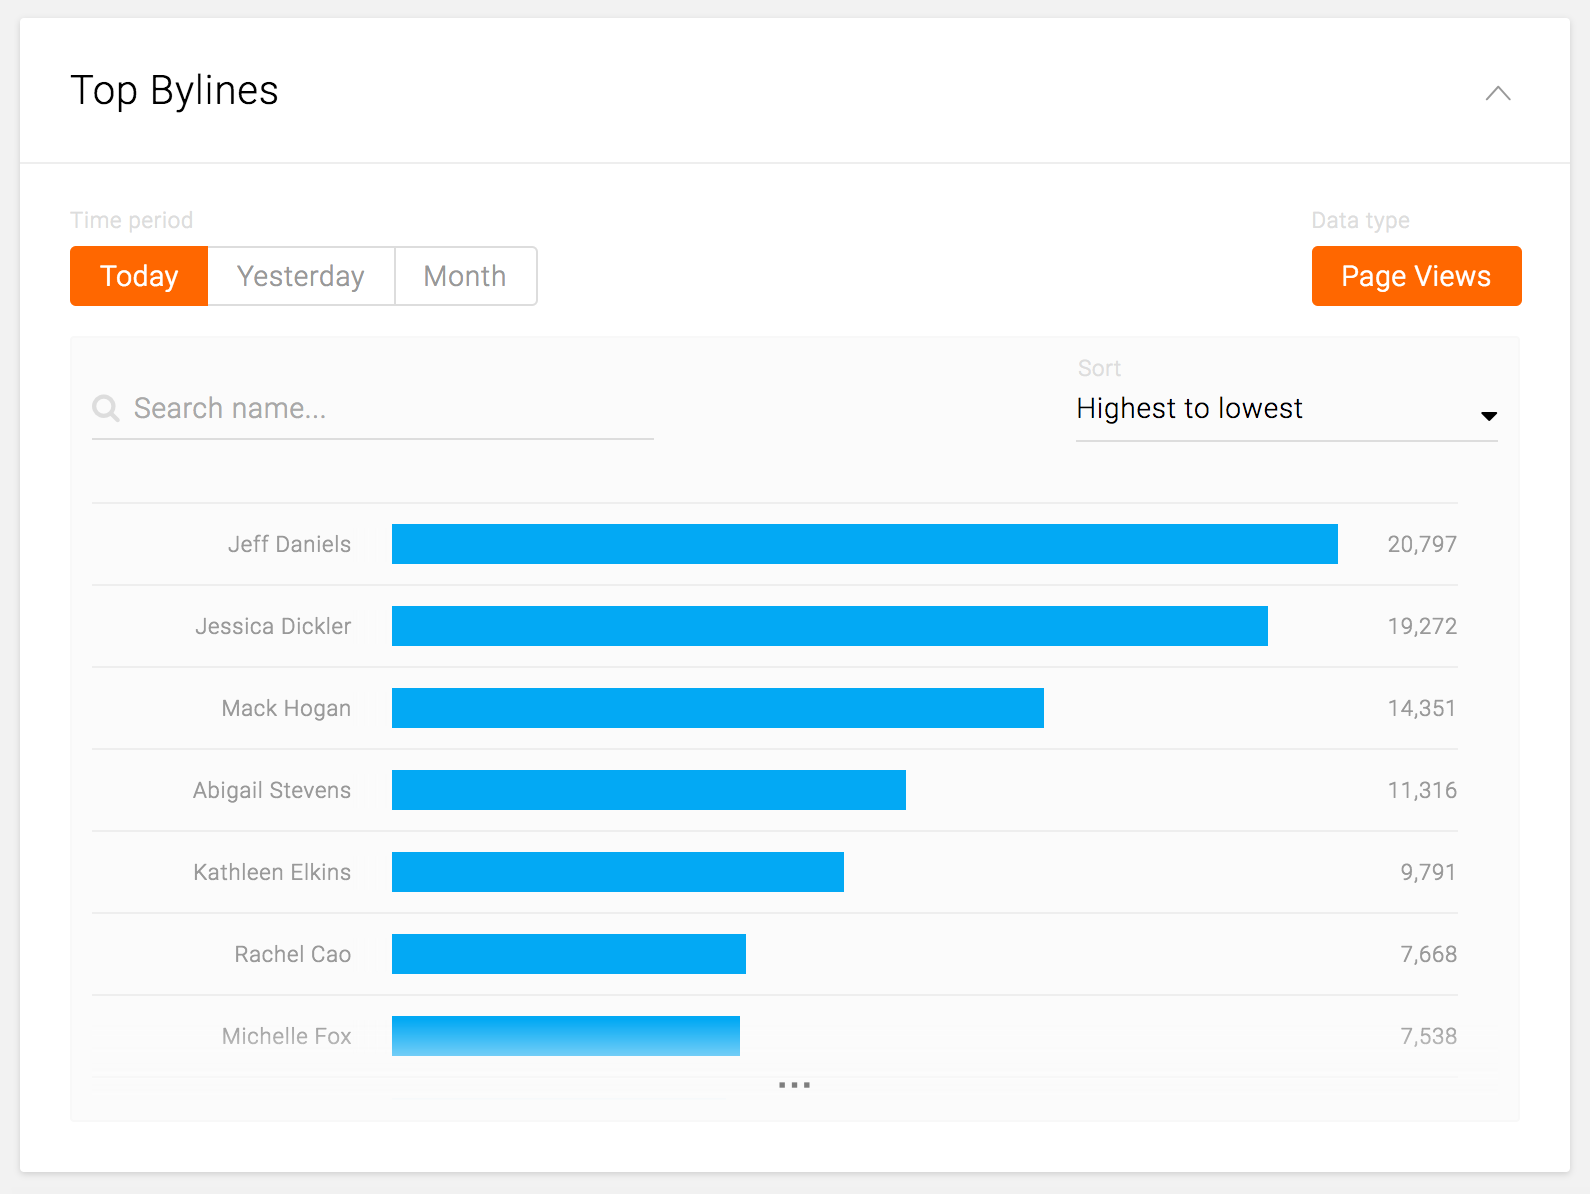
Top Bylines
Features
- See the number of unique visitors of all the articles by each editor/writer for the following:
- Yesterday’s unique visitors
- Month-to-date unique visitors
- See the number of page views of all the articles by each editor/writer for the following:
- Today’s page views
- Yesterday’s page views
- Search by partial string of the name
- Search within the card
- Sort by the following:
- Highest to lowest
- Lowest to highest
- Alphabetical
Available Statistics
- Per category:
- Byline name
- Number of page views or unique visits, depending on the category
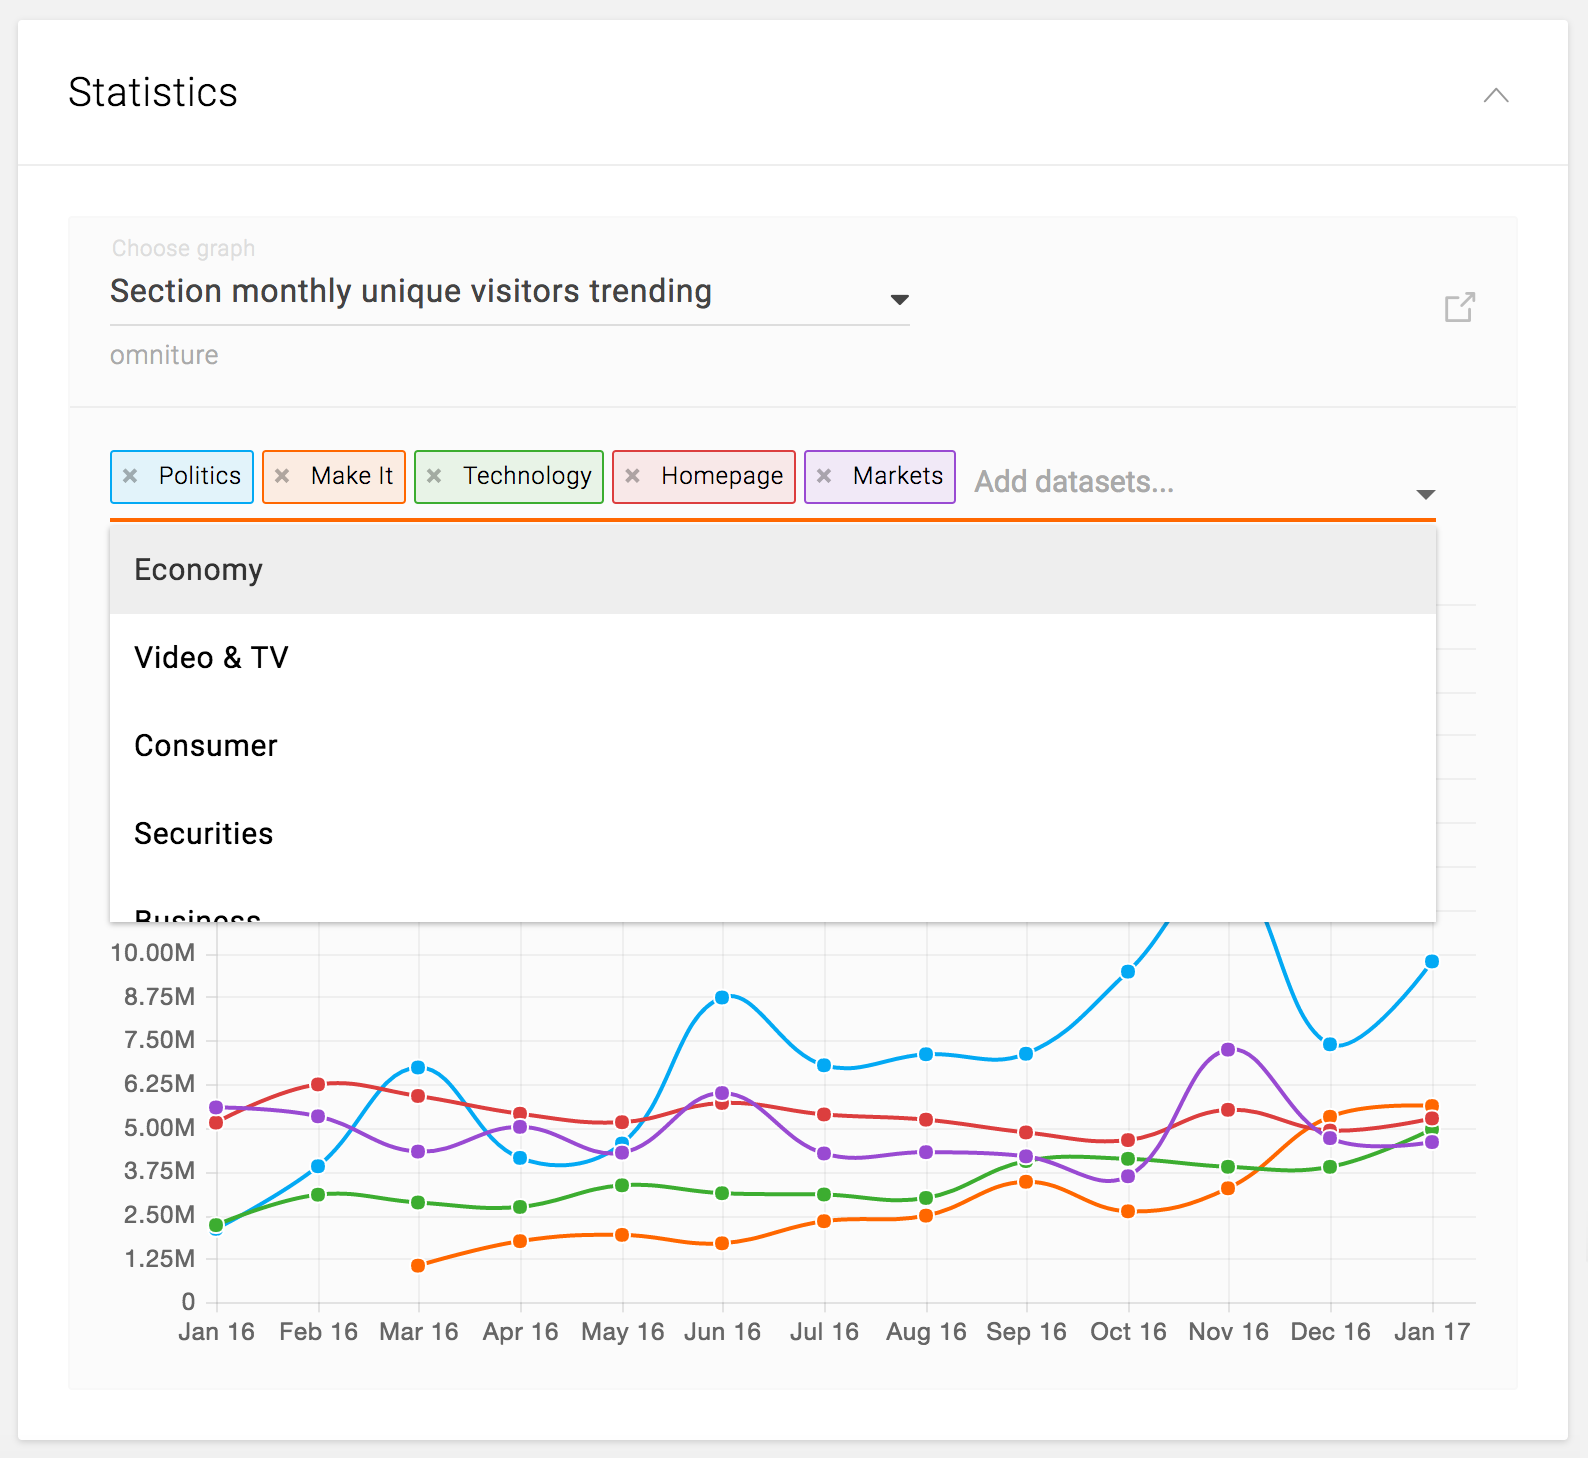
Statistics (Sitewide)
Features
- Toggle to different statistics view:
- Total number of visits
- Total number of page views
- Total number of unique visitors
- Month-to-date unique visitors
- Video viewers
- Video starts
- Section monthly unique visitors trending
- Monthly unique visitors trending
- Hover over each data point to see the exact number
- Abbreviated y-axis numbers
- For the graph that has multiple data sets, e.g. Section monthly unique visitors trending:
- Initially show top 5 dataset with different colors
- Ability to add more dataset to the view
- Ability to remove the dataset from the view
Available Statistics
- Total number of visits
- Sitewide number of visits of the past 7 days
- Total number of page views
- Sitewide number of page views of the past 7 days
- Total number of unique visitors
- Sitewide number of unique visitors of the past 7 days
- Month-to-date unique visitors
- Sitewide number of month-to-date unique visitors of the past 7 days
- Video viewers
- Sitewide number of video completes of the past 7 days
- Video starts
- Sitewide number of video starts of the past 7 days
- Section monthly unique visitors trending
- Number of total unique visitors per month for each section, for the past 12 months
- Monthly unique visitors trending
- Number of unique visitors per month for the entire site, for the past 12 months